
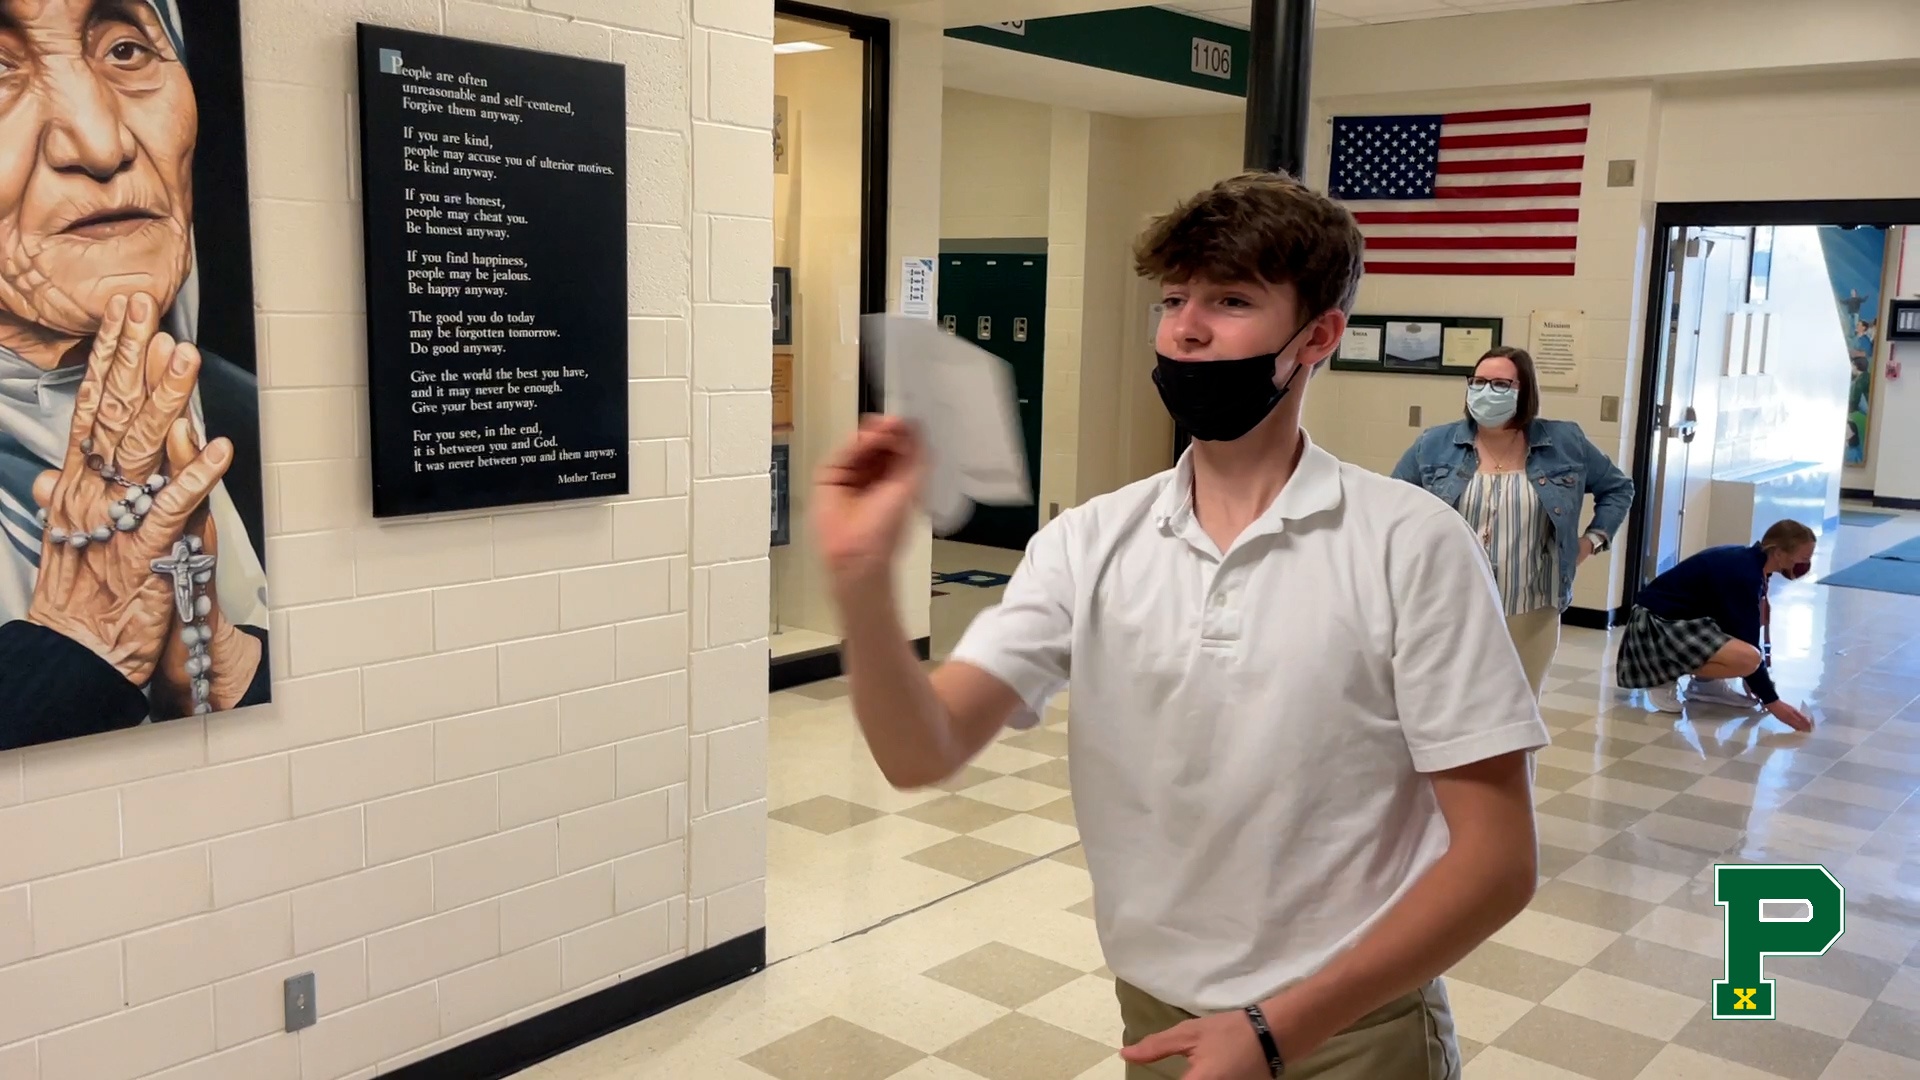
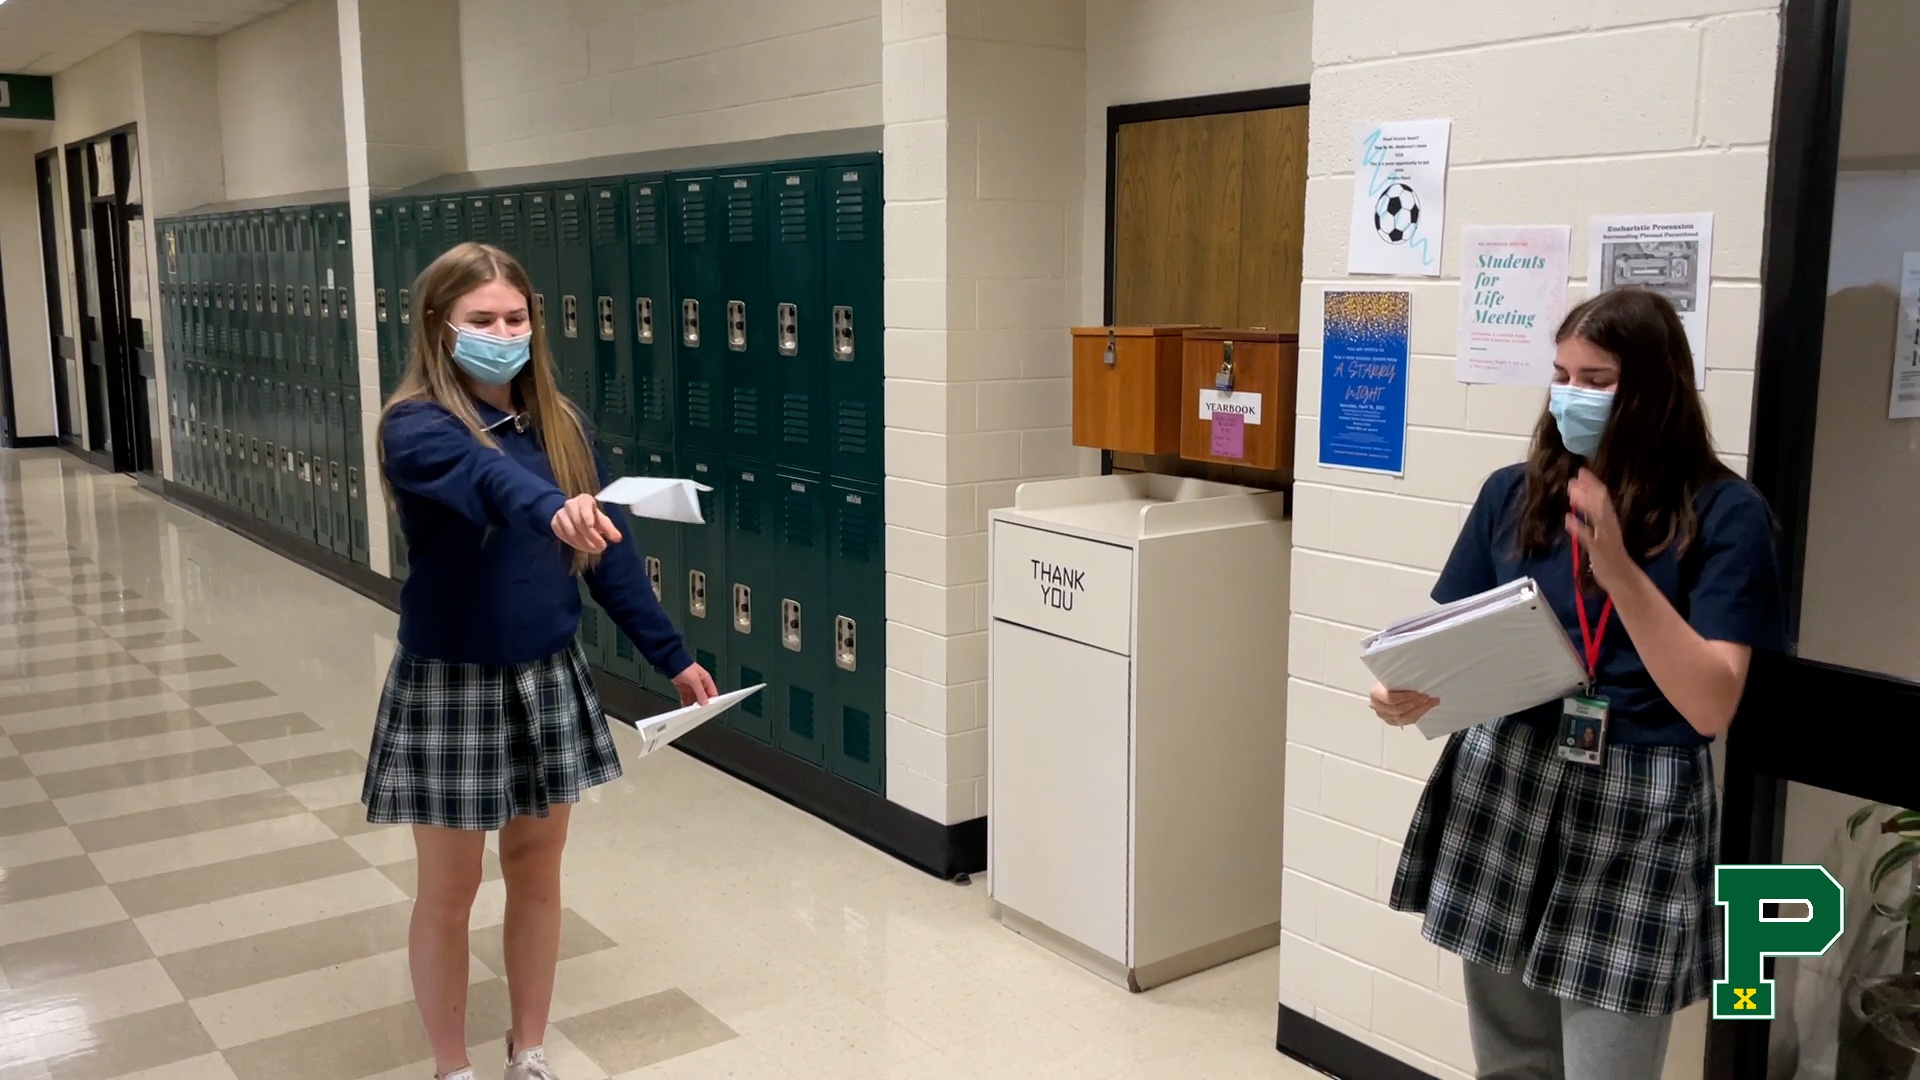
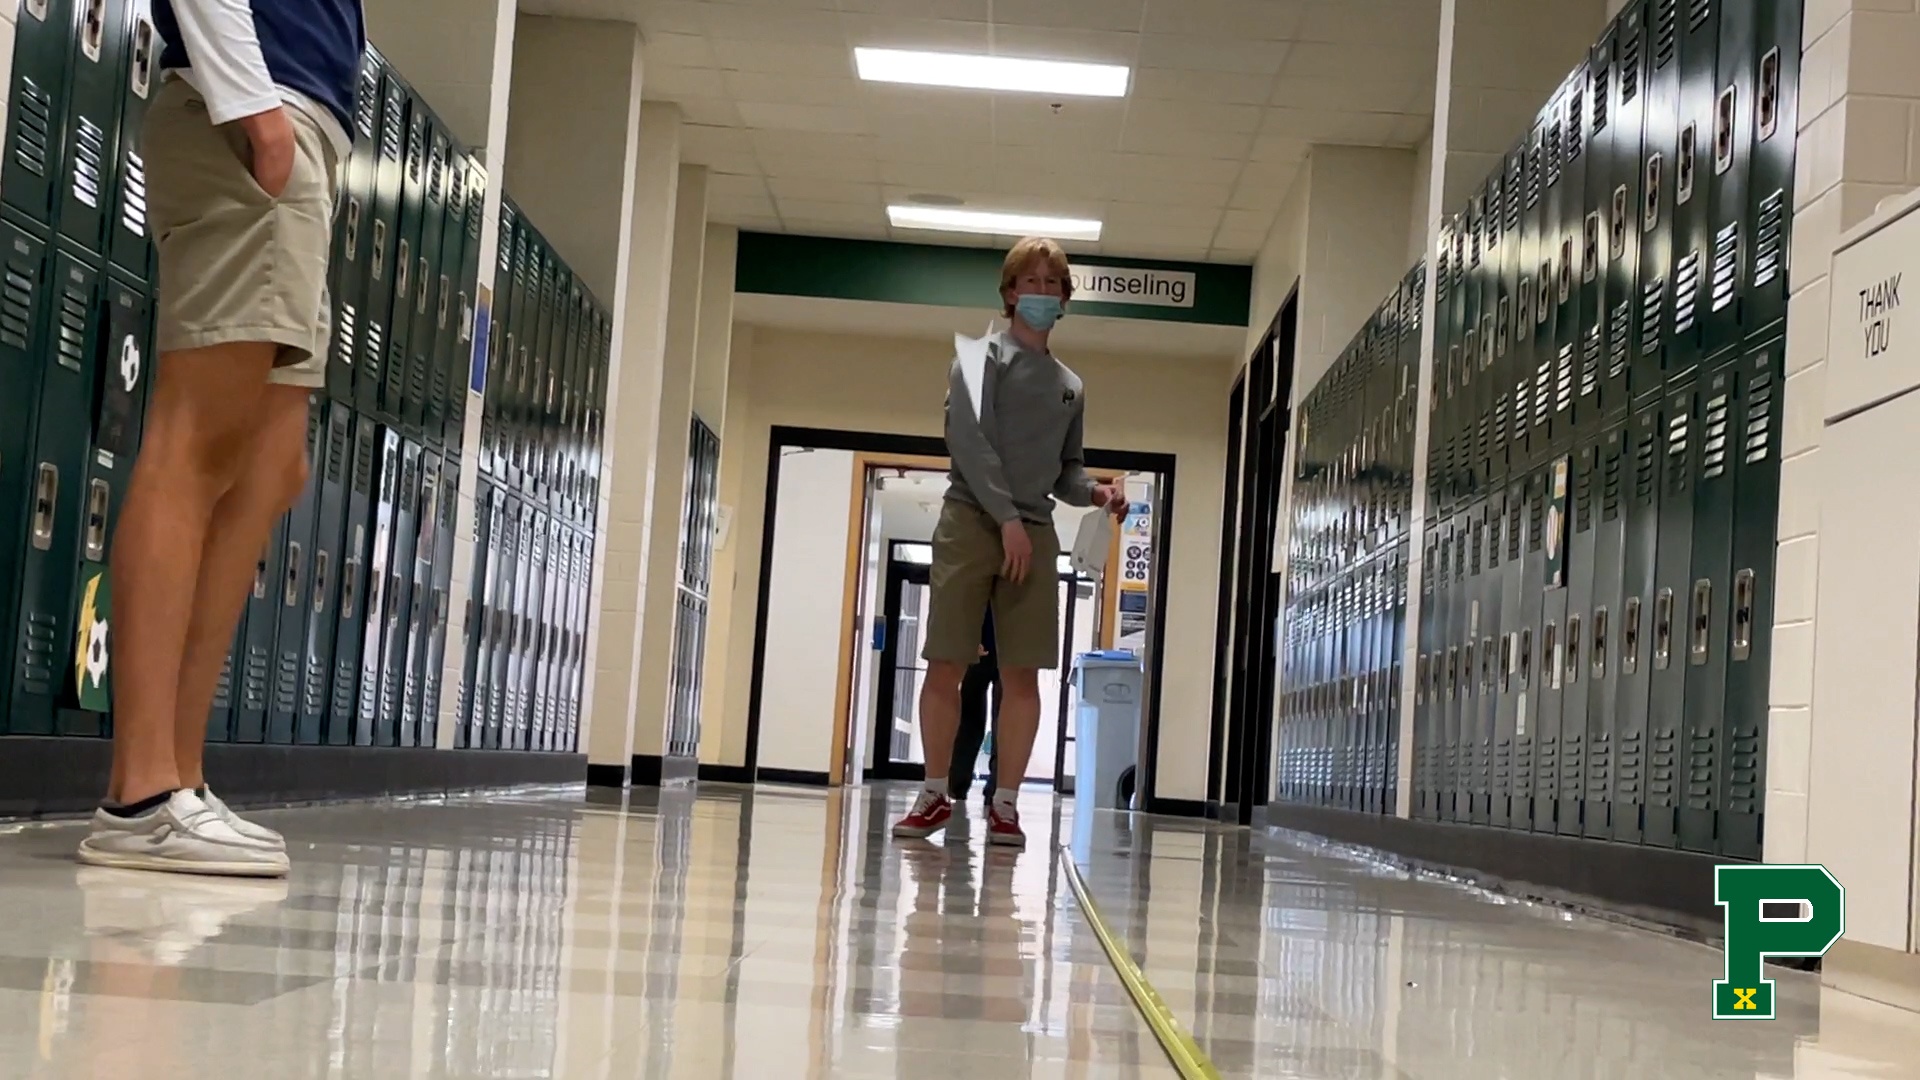
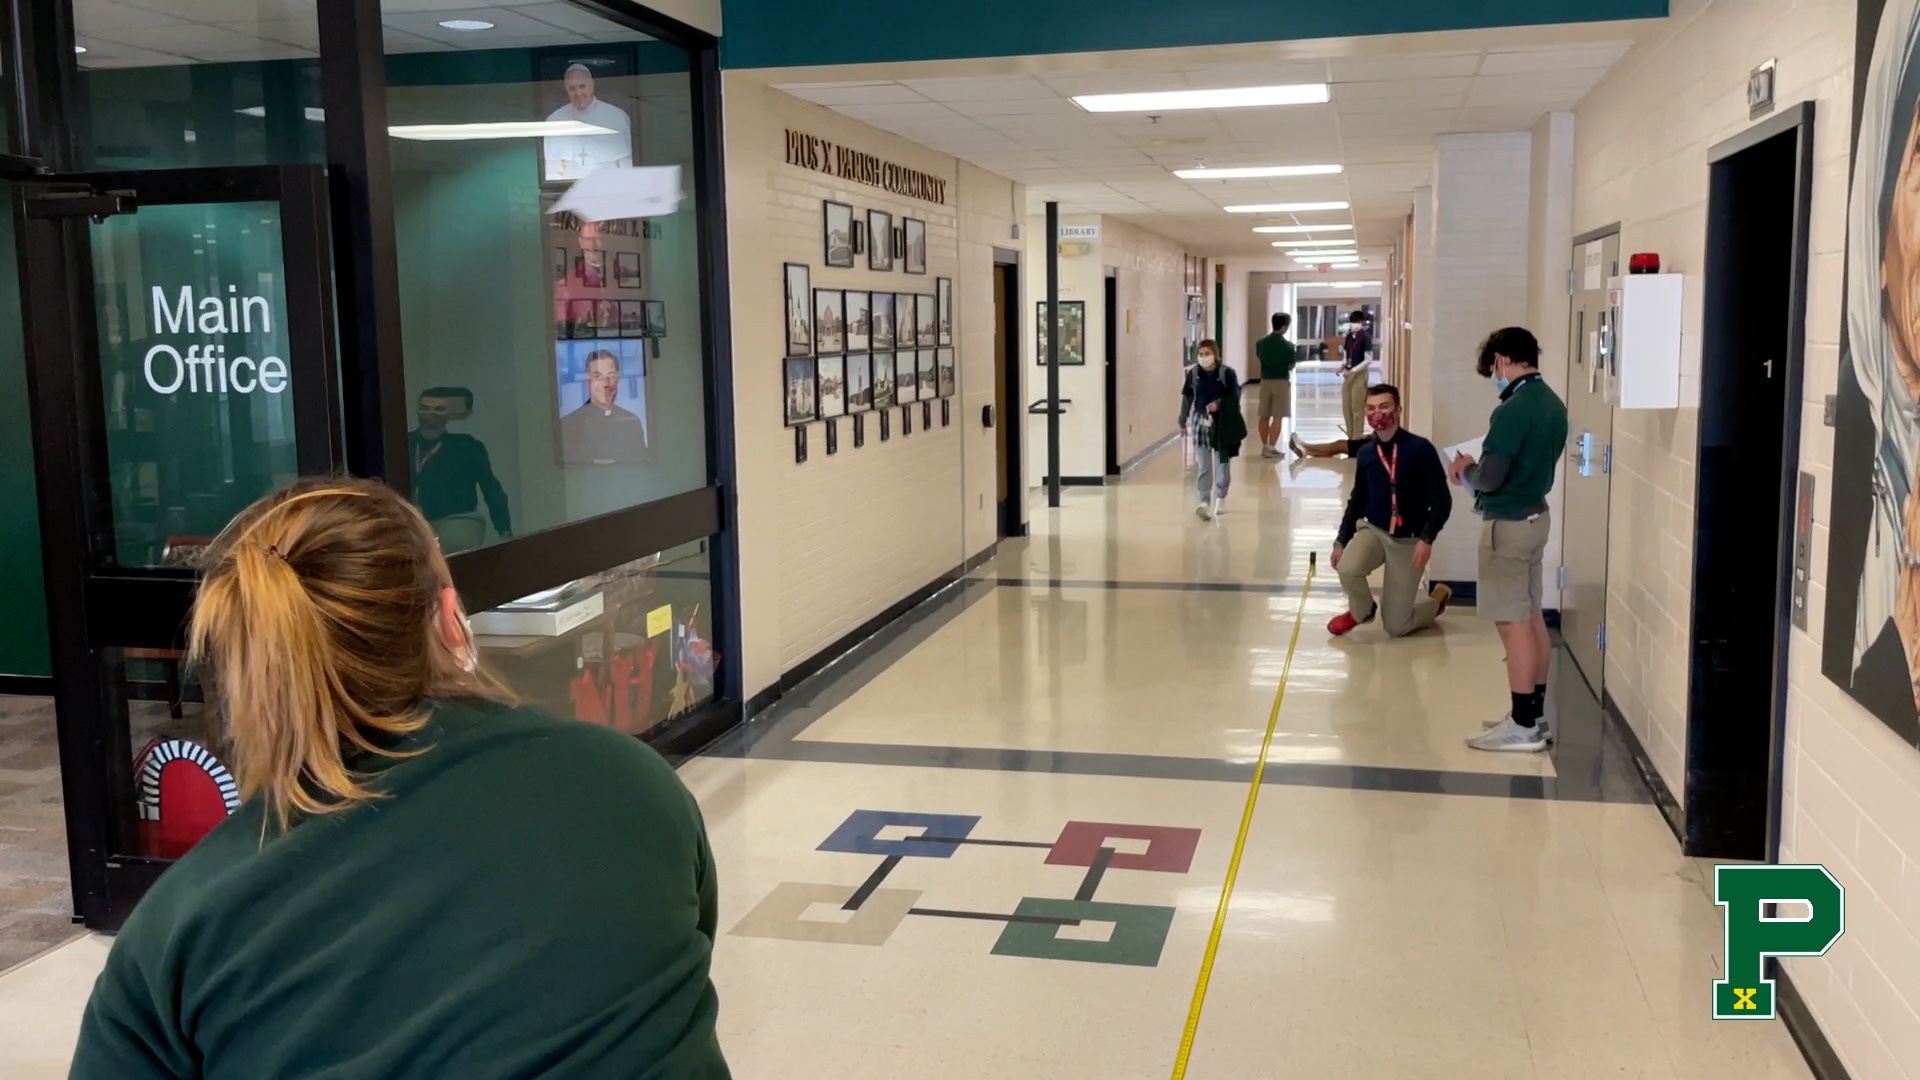
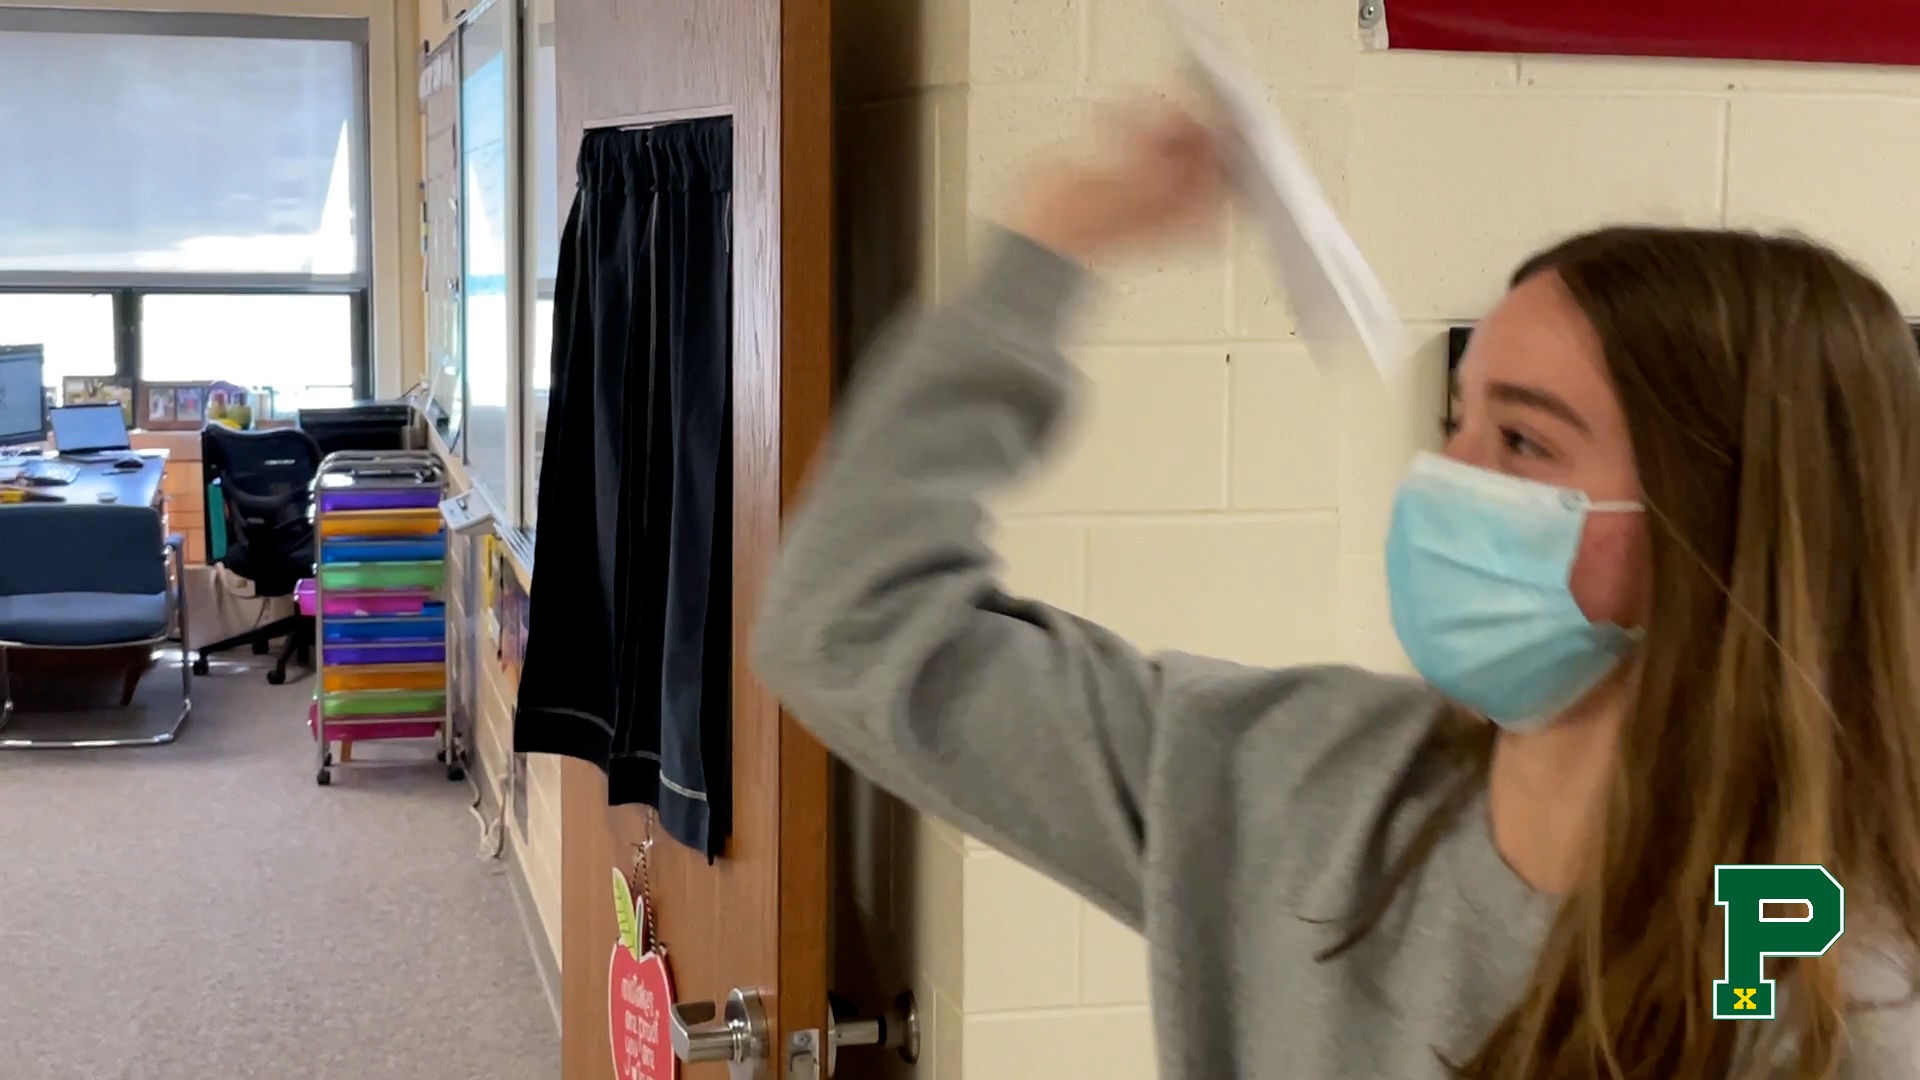
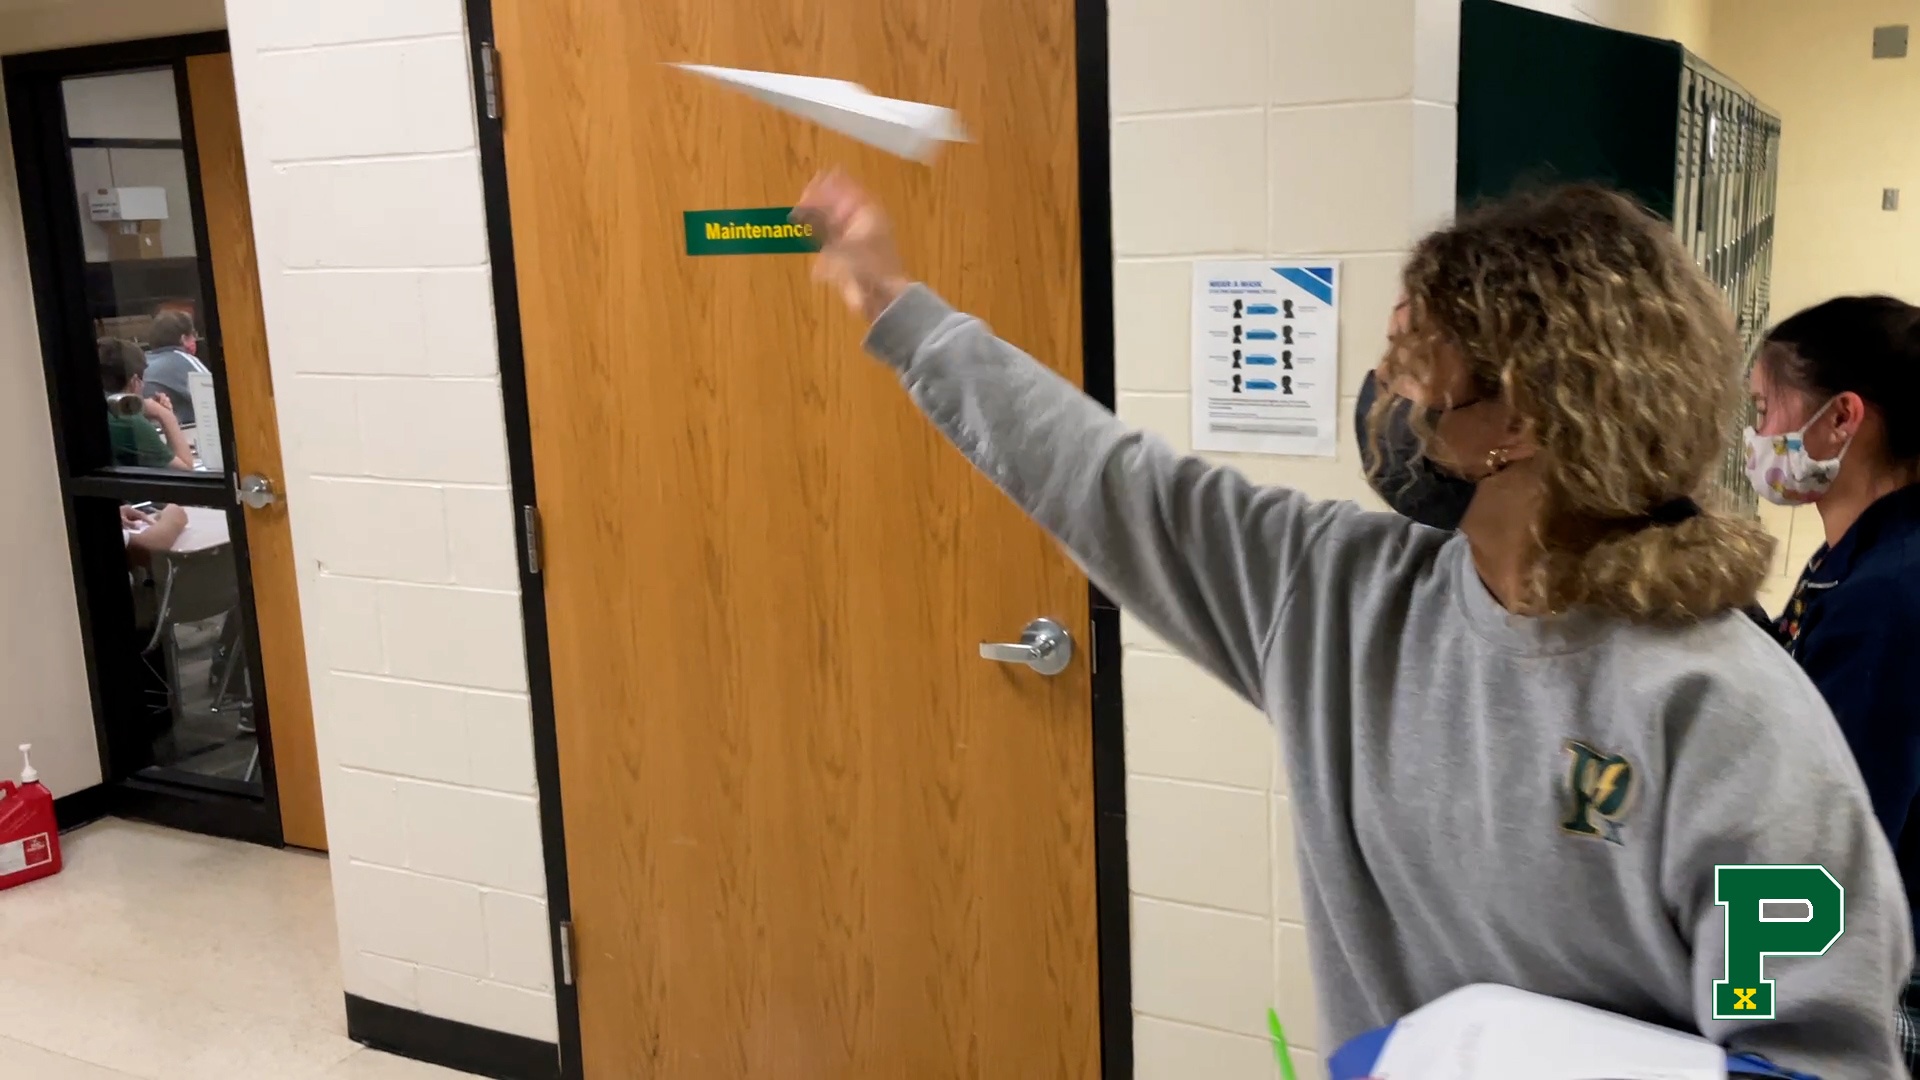
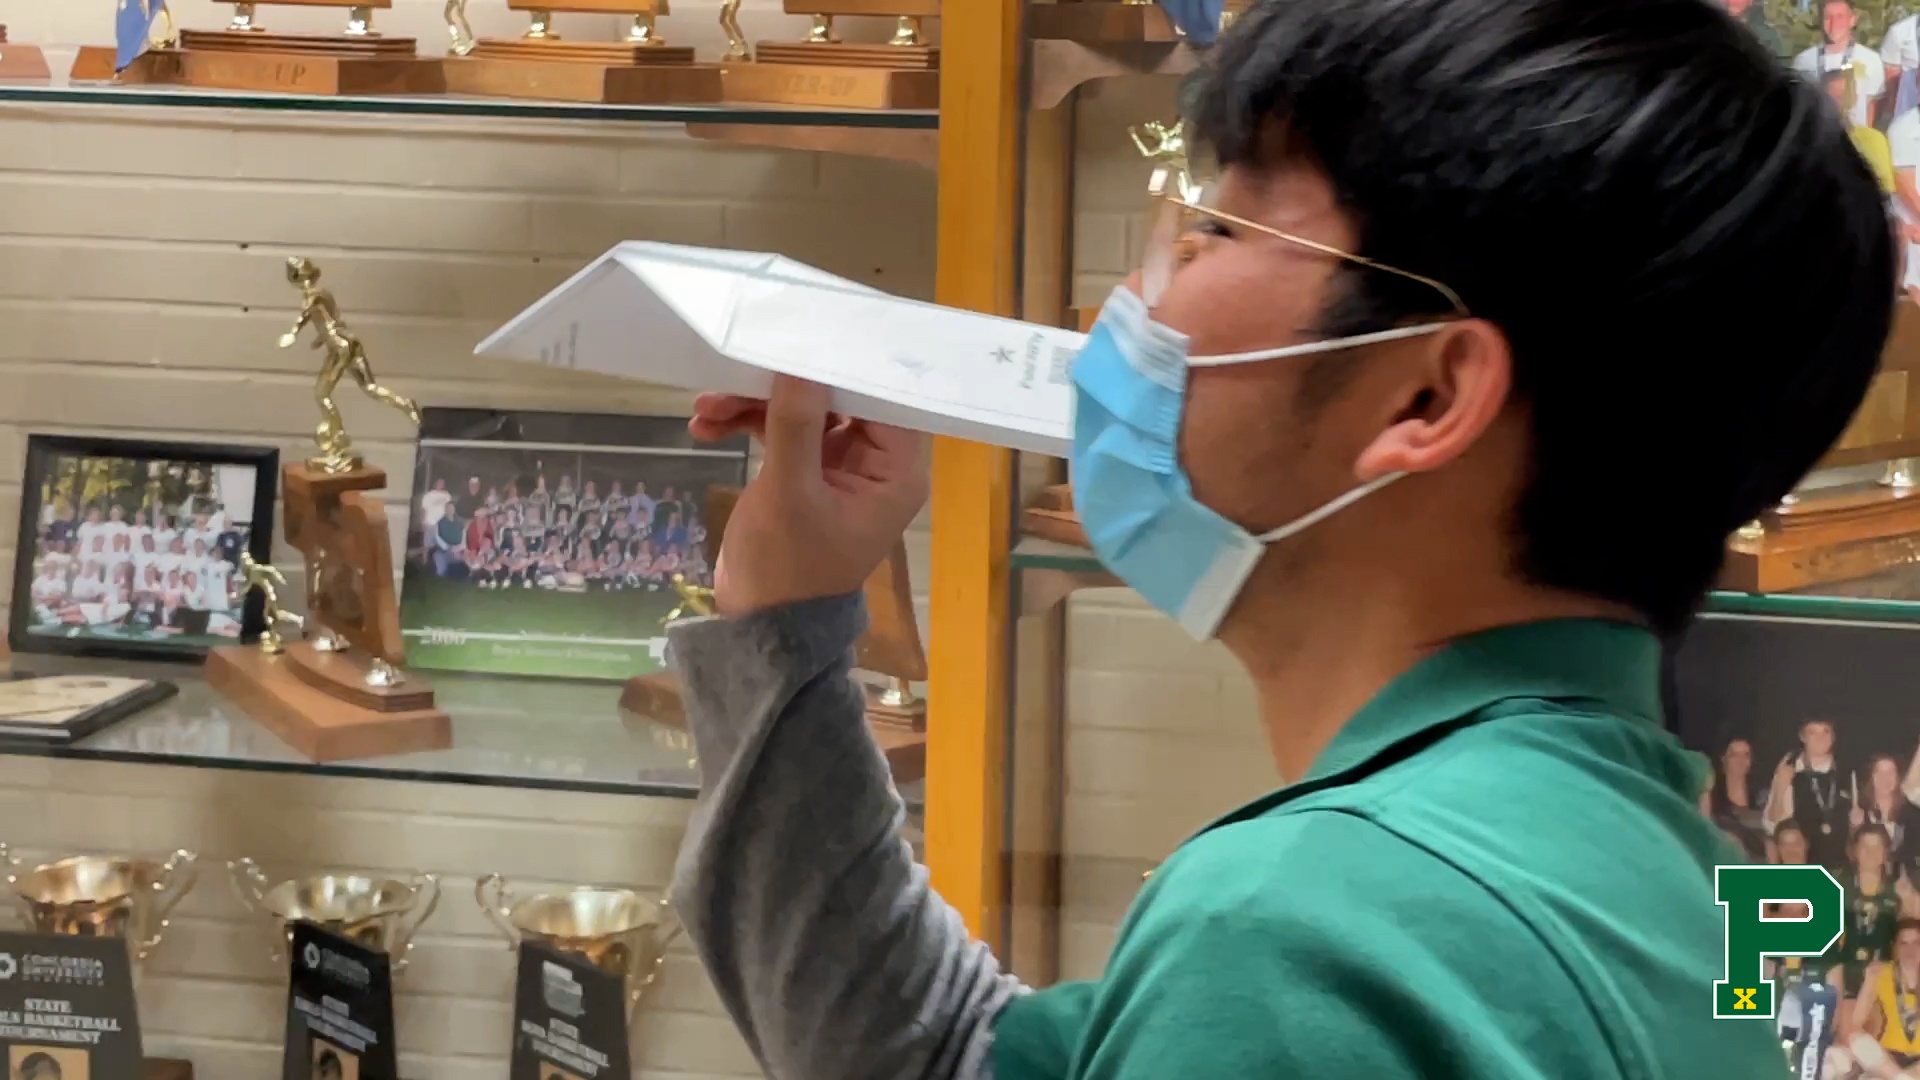
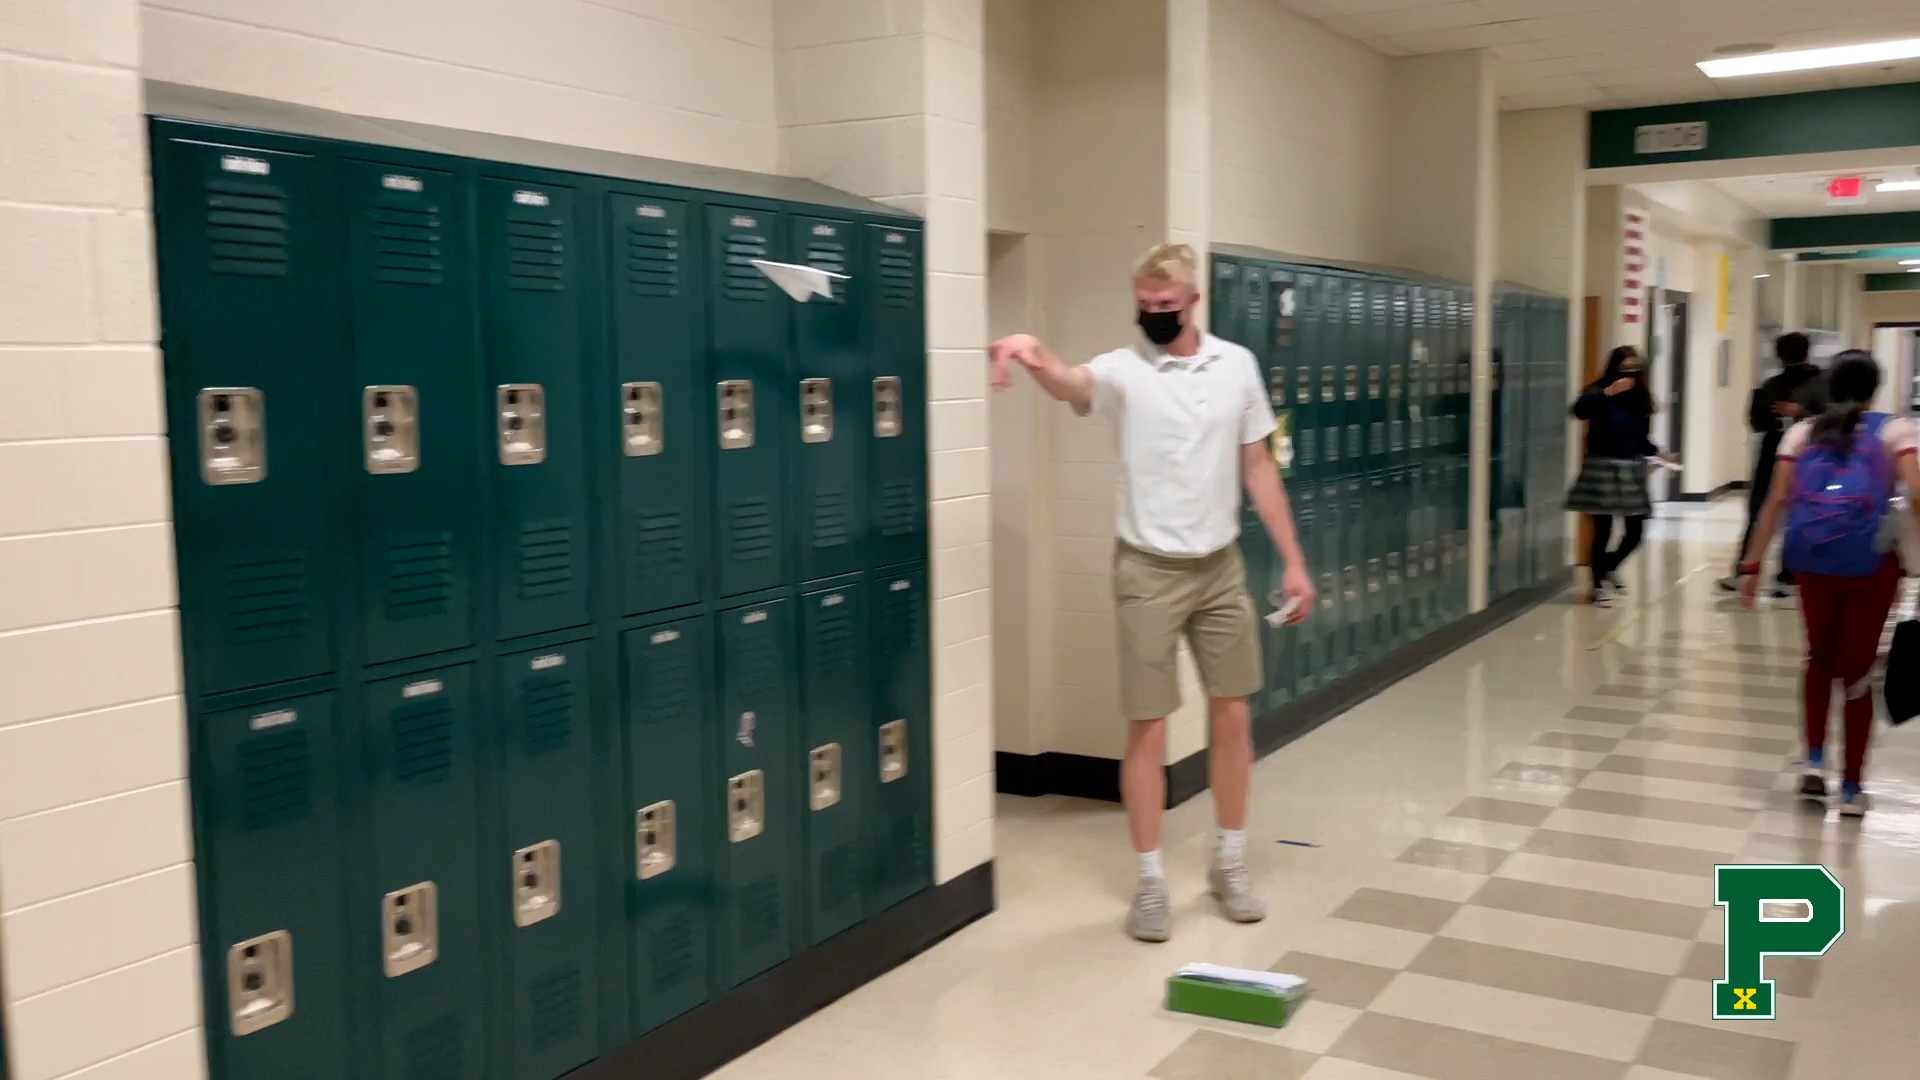
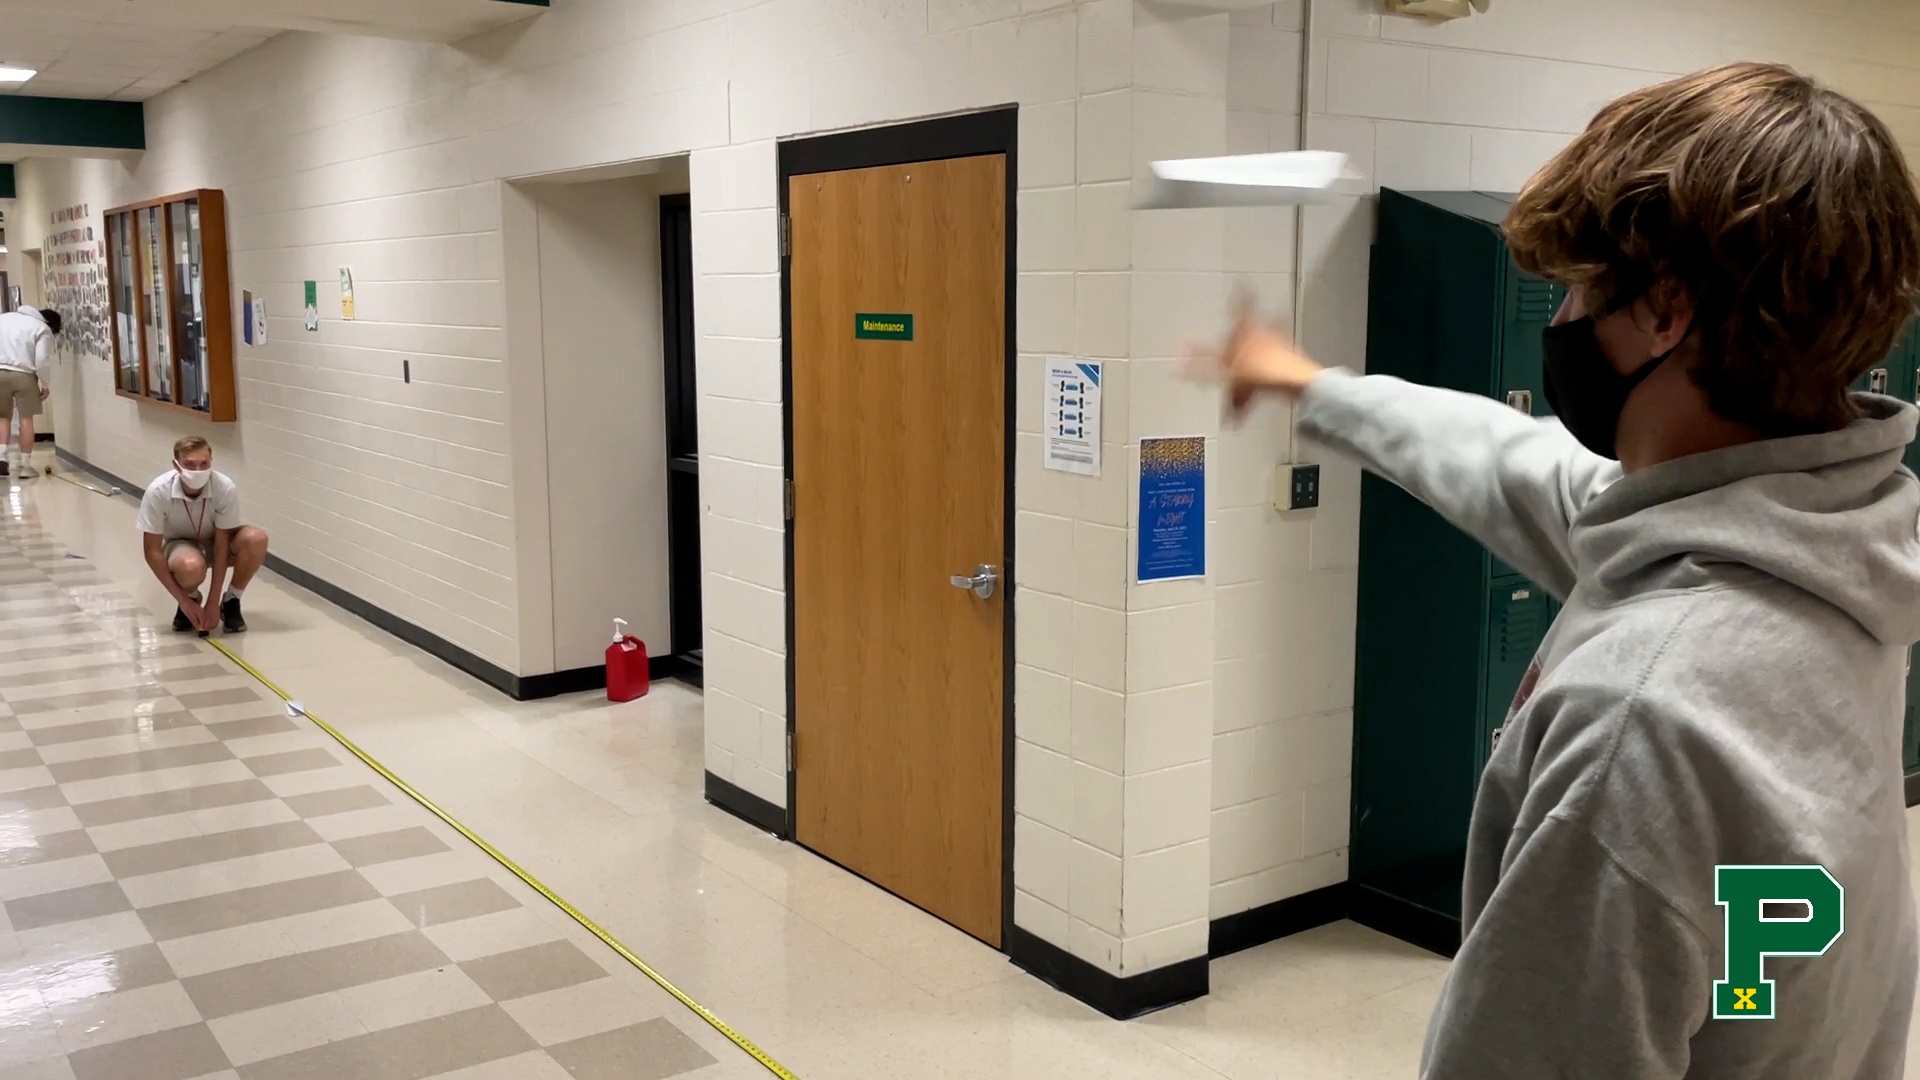
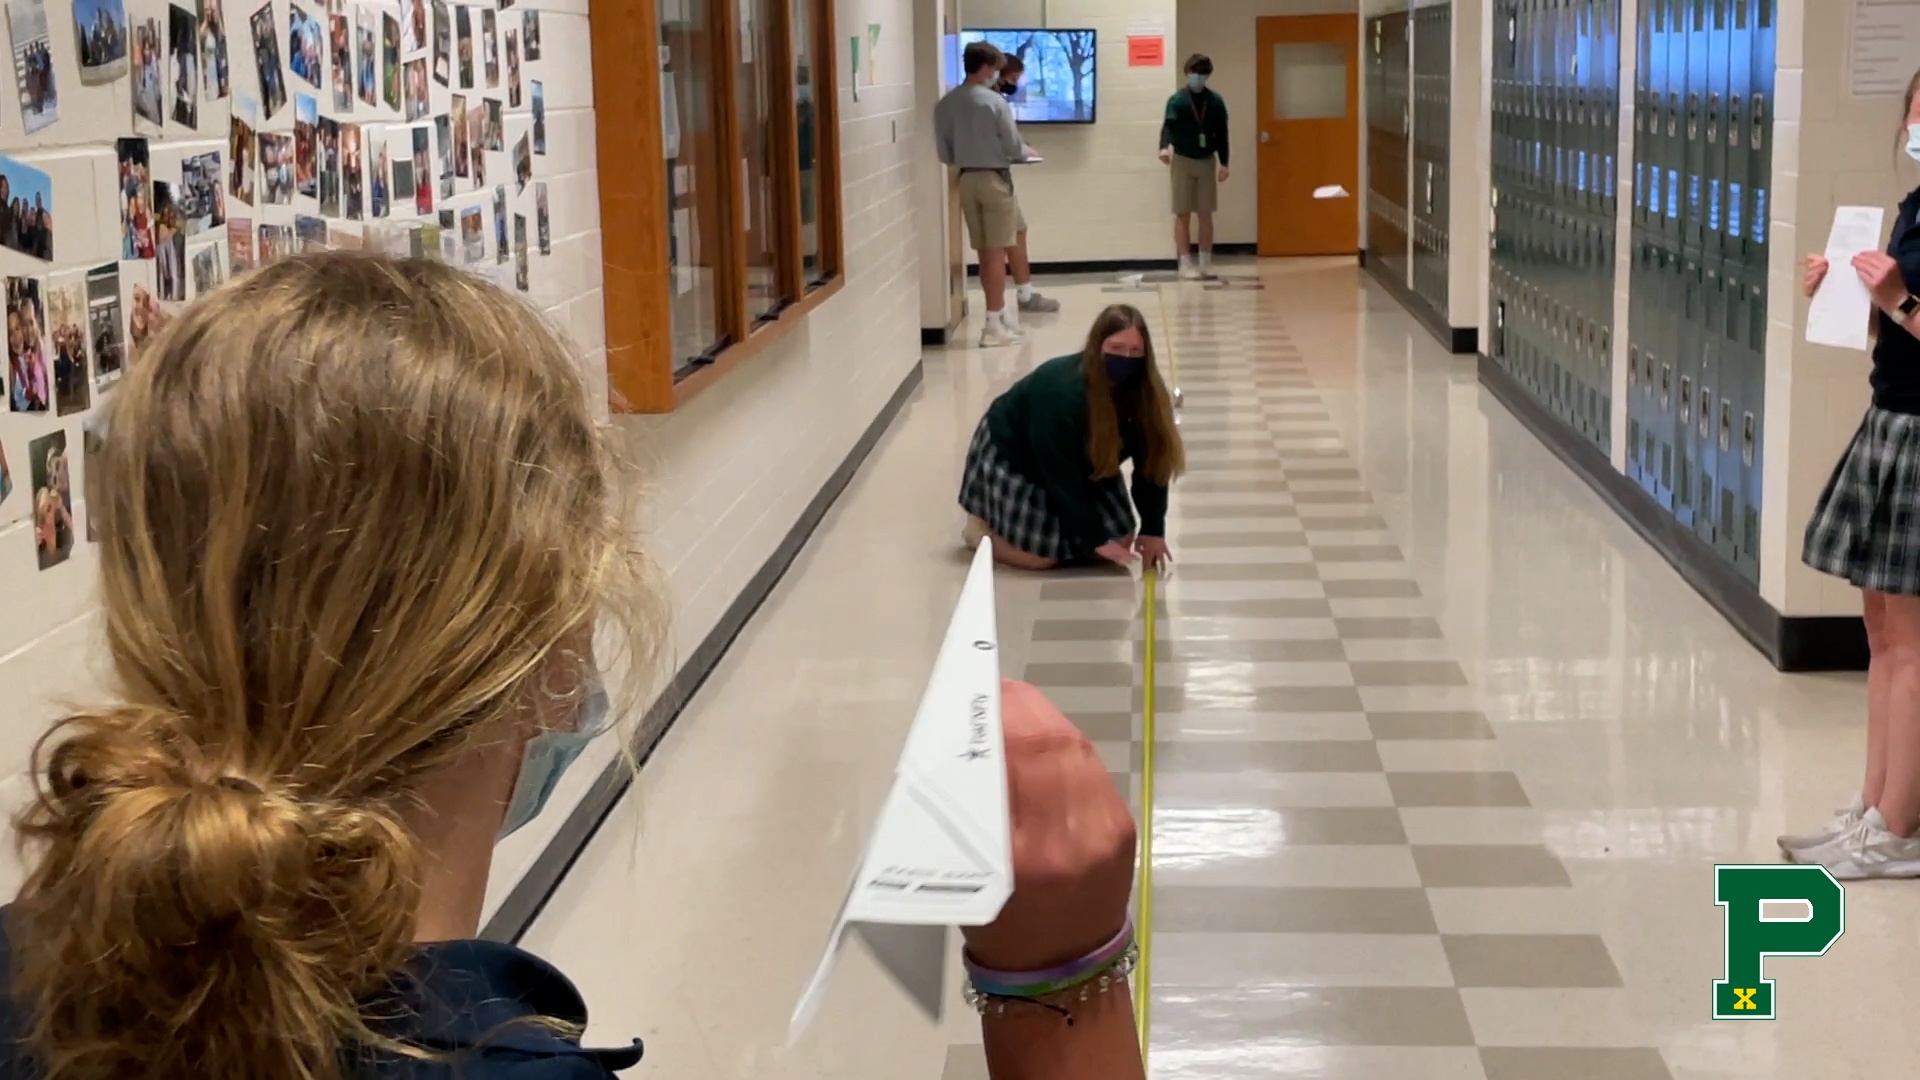
Make two different paper airplanes, toss them each 30 times, mark the distance of each throw, then use the data for analysis. This week, students in Brianna Golka’s AP Statistics classes created their own airplanes and data sets to decide if there is a statistical difference between their two different models.


